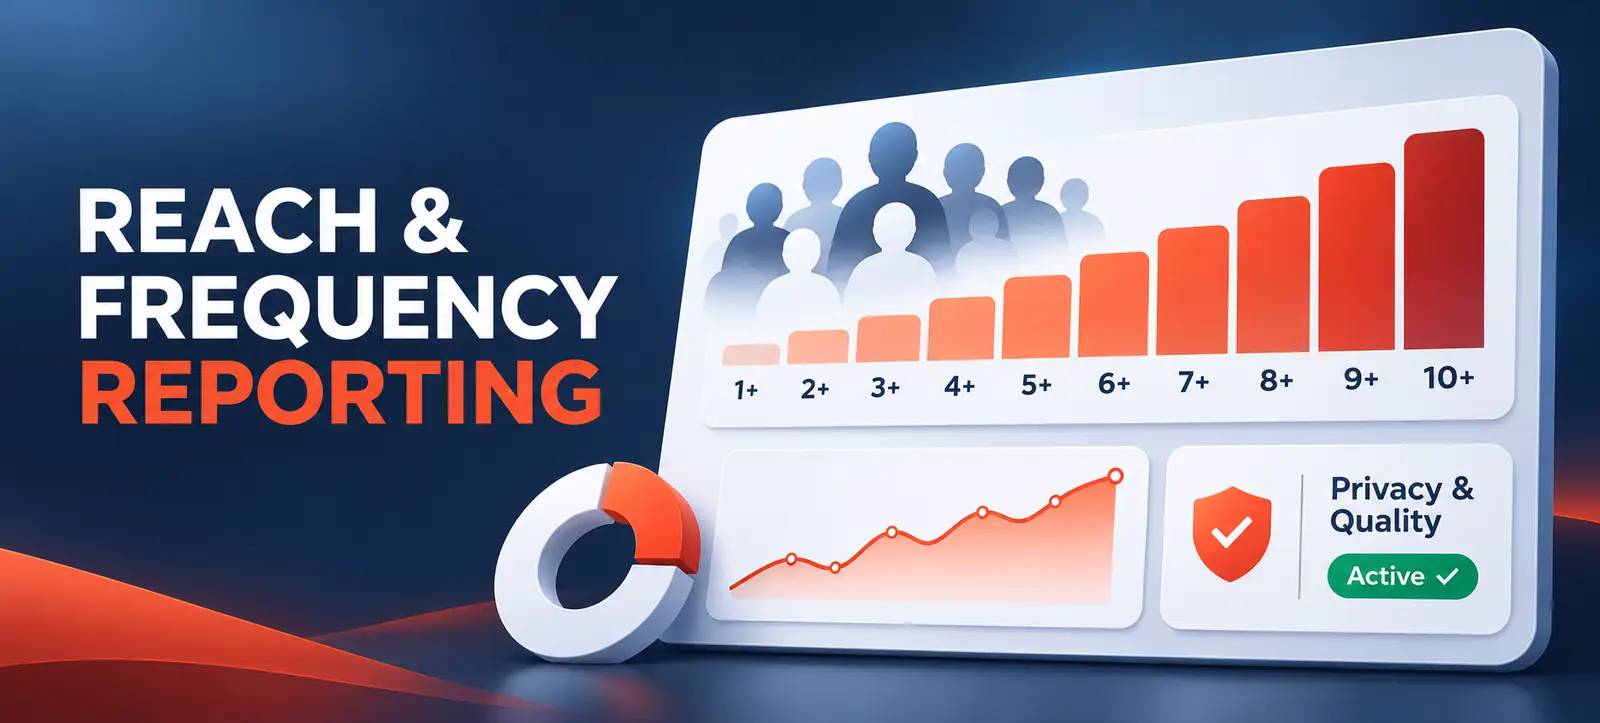
Google Ads reach frequency reporting became more useful for video measurement when Google Ads API v26.1 completed the 1+ to 10+ frequency buckets and added status information for each reach metric. Released on 28 October 2026, the update helps technical teams see how many unique people reached each exposure threshold and why a value may be unavailable.
This is not a reason to chase the highest frequency. It is a better diagnostic layer for judging whether a campaign is building sufficient exposure, saturating a narrow audience or producing data that needs qualification. This practical guide explains the change and a safe reporting workflow.
What changed in Google Ads API v26.1
Google’s official API release notes say v26.1 added the missing six-plus, seven-plus, eight-plus and nine-plus unique-user metrics. Together with the existing fields, teams can now retrieve a continuous set from people reached at least once through people reached at least ten times.
Google also added companion ReachMetricInfo fields for the unique-user metrics. These fields expose metric states, including cases where a value is suppressed for privacy or quality reasons. That distinction matters: a blank, zero or unavailable value should not automatically be treated as no audience reach.
The update is especially relevant to video, Display, Demand Gen and App reporting teams. It does not create a universal “ideal frequency” or make the fields compatible with every campaign, segment and date range.
How to read cumulative frequency buckets
Each N+ bucket is cumulative. The 6+ metric represents unique people who saw an ad at least six times; those people are also included in 1+ through 5+. Do not add the buckets together. Doing so counts the same people repeatedly and produces an inflated audience figure.
To estimate the audience that received exactly N exposures, subtract the next cumulative bucket from the current one. For example, 3+ minus 4+ estimates the people reached exactly three times. Treat that as a derived metric and retain the source values so analysts can audit the calculation.
Signal
Practical interpretation
Decision it can support
1+ reach
Total unique audience reached at least once
Check whether delivery is broad enough for the objective.
2+ to 5+ buckets
Audience moving from initial exposure toward repeated exposure
Compare creative recall needs with audience expansion.
6+ to 10+ buckets
People receiving high repeated exposure
Investigate saturation, narrow targeting or creative fatigue.
Metric state
Context about availability, privacy or data quality
Separate a suppressed value from a genuine zero.
Average frequency
Overall average exposures per unique user
Use as context, not as a substitute for the distribution.
Respect the reporting limits
Google’s video campaign reporting documentation states that the N+ bucket metrics support date ranges of up to 31 days and can be segmented only by date and device. The general unique-users and average-frequency metrics can support up to 92 days and additional adjusted age and gender segments.
Reach metrics also cannot be aggregated across rows. If a dashboard sums daily unique users to create a monthly total, the same person may be counted on multiple days. Request the required period directly and keep the query window, campaign type and segmentation attached to every output.
A practical implementation workflow
1. Define the business question. Decide whether the report should diagnose audience saturation, compare creative waves, support a reach objective or guide a budget review. A reporting request without a decision becomes another dashboard that nobody uses.
2. Confirm campaign eligibility. Inventory campaign types, dates, devices and available reach fields. Test one representative campaign before changing a production pipeline. For broader context, use Kayaar’s Google Ads measurement stack guide to place reach beside conversions, attribution and experiments.
3. Upgrade safely. Check the API version, client library, typed models and warehouse schema. Minor API releases are backward-compatible at the endpoint, but a client library must include the new field definitions. Add nullable columns and preserve raw state values rather than converting every missing metric to zero.
4. Build a valid query. Select campaign identifiers, date range, device when needed, unique-user buckets and matching info fields. Validate selectable combinations against current field metadata. Keep the query under the correct window instead of silently truncating the requested dates.
5. Validate the output. Check that cumulative values generally decrease or remain equal as thresholds rise. Flag impossible increases, duplicate rows, unsupported segments and missing states. Compare a sample with the Google Ads interface where an equivalent view is available.
6. Add commercial context. High frequency may be acceptable for a short launch but wasteful for an always-on prospecting campaign. Review budget, audience size, creative age and outcome quality together. Kayaar’s channel prioritisation guide can help connect delivery signals to budget choices.
Turn the buckets into useful actions
A steep drop between 1+ and 2+ suggests many people saw the campaign only once. That may be fine for broad awareness, but insufficient when the message needs repetition. A large share remaining at 8+ or 10+ can signal concentrated delivery. Before reducing spend, check whether the campaign is retargeting, serving a small high-value market or running for a short period.
For Demand Gen, compare frequency with placements, audience expansion and creative variation. Kayaar’s Demand Gen updates guide explains why channel controls and creative formats also affect delivery. For video production, use the YouTube ads creative workflow to prepare variants before fatigue becomes a performance problem.
Do not set one automatic threshold for every account. Create review bands by objective, audience temperature and campaign duration. Require a human analyst to approve any budget, targeting or creative change.
Show the selected period and supported campaign scope.
Record query version, extraction time and transformation logic.
Protect customer IDs and access credentials.
If your team needs a controlled reporting plan, contact Kayaar with the campaign types, measurement objective and reporting environment. Do not send API credentials or customer-level exports through an unsecured form.
FAQs
What changed in Google Ads reach reporting in v26.1?
Google completed the 1+ through 10+ cumulative frequency buckets and added companion state information for unique-user reach metrics.
Can I add the frequency buckets together?
No. The buckets are cumulative, so adding them repeatedly counts the same people and inflates the reported audience.
What does a missing reach value mean?
It may be unavailable or suppressed for privacy or quality reasons. Check the matching metric state before interpreting it as zero.
How long can a frequency-bucket query run?
The N+ unique-user buckets support date ranges of up to 31 days and only date and device segmentation.
Does high frequency always mean wasted budget?
No. Interpret it against the objective, audience size, campaign duration, creative age and business outcomes before changing delivery.