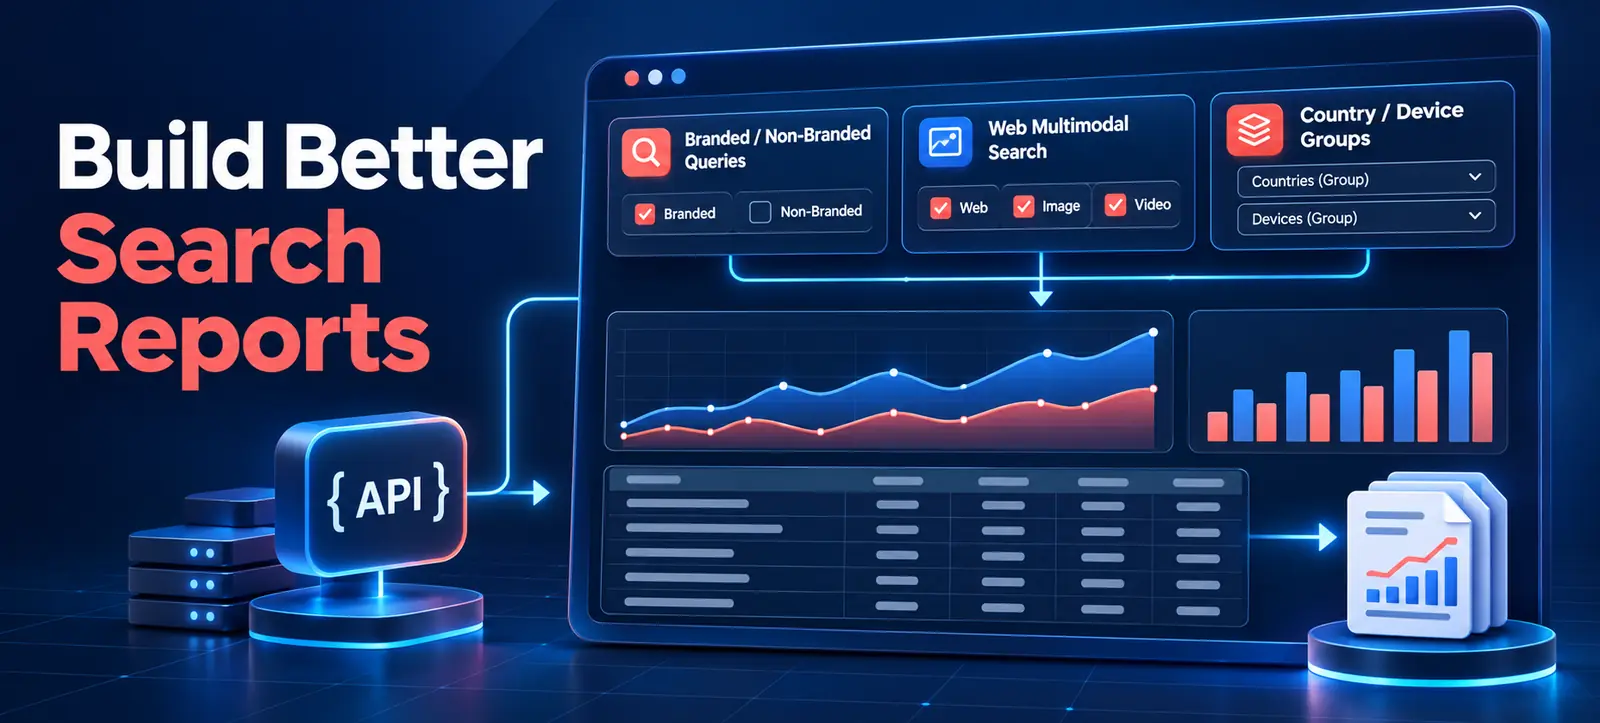
Search Analytics API filters now support three reporting capabilities previously added to Search Console: branded-query classification, web-multimodal performance and multiple country or device values in one request. Google announced the API expansion on 16 November 2026.
The update can simplify regional dashboards and reduce manually maintained query lists. It can also create misleading comparisons if teams ignore eligibility, aggregation, row limits or incomplete data. This practical audit explains how to design and validate an automated report before relying on it.
What Google added
Google’s official Search Central announcement introduces three options. The brandedClassification dimension can group or filter branded and non-branded performance for eligible properties. The webMultimodal type returns traffic from Google Lens, Circle to Search on Android and image uploads in Google Search. The new filterLists field accepts several countries or devices in a single request.
These are reporting controls, not ranking signals. They do not reveal how Google ranks a page or guarantee that every query appears. The API returns top rows within Search Console’s internal limits, so an automated export should not be presented as a complete query log.
Capability
Request field
Useful question
Primary validation
Branded classification
brandedClassification
Is visibility growing from brand demand or discovery?
Confirm property eligibility and missing-row handling
Web multimodal
type: webMultimodal
Which pages earn visual-search activity?
Keep it separate from standard web totals
Country groups
filterLists: country
How does a defined regional hub perform?
Version the three-letter country-code list
Device groups
filterLists: device
How do selected devices perform together?
Use only desktop, mobile and tablet values
Start with a reporting contract
Before writing a request, document the report’s owner, audience, property, date window, timezone, dimensions, filters, aggregation and refresh schedule. Define what each chart is intended to support. A report for editorial planning should not silently become a finance-grade or forecasting dataset.
The API uses Pacific Time for start and end dates. Record this explicitly when business dashboards use Dubai or another local timezone. Daily totals can otherwise appear offset near reporting boundaries. Keep the raw response and request payload for each refresh so analysts can reproduce a result.
Use read-only authorisation where possible and assign access to named accounts or approved service identities. Kayaar’s Search Console access audit provides a governance checklist for ownership, permissions and offboarding.
Audit branded-query classification
Google documents BRANDED and NON_BRANDED as the supported values. Data begins from 21 February 2026 and is limited to eligible top-level properties with sufficient query and impression volume. An ineligible property can return no rows; that is not the same as zero branded activity.
Do not combine brandedClassification grouping or filtering with a query filter in the same request. Build separate jobs when analysts need query-level investigation. Add an explicit “unavailable” state to the dashboard instead of converting an empty response into a zero.
Compare like-for-like periods and properties. Brand demand can change because of campaigns, seasonality, news, offline activity or naming ambiguity. Treat the classification as a useful Google-provided segment, not an infallible definition of the organisation’s brand universe.
Separate web multimodal reporting
Set type to webMultimodal for Lens, Circle to Search and image-upload performance. Keep this series separate from the default web type because the search contexts differ. Label the source clearly in tables, exports and executive charts.
Review landing pages, clicks, impressions, CTR and position over meaningful periods. Low-volume data may be volatile, so avoid ranking pages from a few observations. Kayaar’s multimodal Search report guide explains how to connect visual demand with page and image improvements without assuming causation.
If the property uses Search Console bulk data export, Google says web-multimodal data is also available in BigQuery. Reconcile field definitions and date ranges before combining API and warehouse extracts.
Build reusable country and device groups
The filterLists field accepts exact-match lists for country or device. Countries use three-letter codes, while devices use DESKTOP, MOBILE or TABLET. A single request cannot filter the same dimension in both filters and filterLists.
Store region definitions in configuration, not inside dashboard formulas. Give each group a name, owner, version date and approved member list. “EMEA” can mean different markets to different teams, so the report must expose its definition.
Kayaar’s country and device filtering audit provides a complementary interface workflow for checking combined segments and preventing averages from hiding a weak market or device.
Control aggregation, limits and freshness
The Search Analytics query reference states that results are sorted primarily by clicks and do not guarantee every data row. The maximum rowLimit is 25,000, with startRow used for pagination. Stop only after a successful response returns no more rows, and log the pages retrieved.
Choose aggregation deliberately. If the report groups or filters by page, property aggregation is not available. Record the returned responseAggregationType and do not compare page-aggregated and property-aggregated totals as if they were identical.
Use finalized data for stable recurring reports. If dataState includes fresh or hourly data, label incomplete periods and store the metadata marking the first incomplete date or hour. Reprocess those periods after data finalises rather than leaving provisional totals permanently in the trend line.
Run a pre-launch reconciliation
Test a short, completed date range. Compare the API output with the equivalent Search Console view using the same property, search type, dimensions, filters and dates. Exact totals may still differ because of query limits, privacy and aggregation, but unexplained large gaps should block publication.
Validate empty responses, permission failures, quota errors, pagination, timeouts and schema changes. The dashboard should display a clear stale-data warning instead of carrying forward yesterday’s numbers as current. Kayaar’s Search Console AI performance guide offers a practical framework for adding page-level notes and separating observation from unsupported conclusions.
Weekly dashboard QC checklist
Confirm property, date timezone, search type and aggregation.
Version country and device lists outside the chart logic.
Distinguish unavailable classification data from true zero values.
Paginate responses and record returned row counts.
Label incomplete data and reprocess it after finalisation.
Reconcile sampled outputs against Search Console before release.
For an independent search-reporting review, contact Kayaar with an anonymised request design and dashboard objective. Never share OAuth tokens, API secrets, passwords or unrestricted exports.
FAQs
What changed in the Search Analytics API?
Google added branded classification, web-multimodal reporting and multi-value country or device filters to the API.
Can every property use branded classification?
No. Google limits the data to eligible top-level properties with sufficient query and impression volume.
What does webMultimodal include?
It covers performance from Google Lens, Circle to Search on Android and image uploads in Google Search.
Does the API return every Search Console row?
No. Google states that internal limits apply and the API returns top rows rather than guaranteeing every row.
How should incomplete data be handled?
Label provisional periods, store the incomplete-date metadata and reprocess those dates after the data becomes final.